
This project uses GIS to assess deforestation based on travel times in the Peru Amazonian forest area (see Map 1). More than 90% of deforestation occurs in the 0 to 50 hour travel time area. Furthermore, the deforested areas exhibit a clustering pattern in low travel time areas. The results of this project provide a clearer understanding of the relationship between geography and opportunity in Peru, which is critical given the country’s current efforts to create sustainable regulation and plan for forestry development.
Introduction
In this study, we used GIS to evaluate deforestation patterns in Peru. Deforestation is of great interest and concern in the Amazonian region due to the slow forest succession rates of tropical forests as well as the importance of maintaining one of the most biologically diverse and rich areas in the world. Tropical forests play a significant role in ecological services. However, due to increasing demand for timber, space, and other resources in the Amazon, more and more trees have been cut down. In Peru, deforestation has increased from approximately 45,000 hectares cleared in 2004 to approximately 165,000 hectares cleared in 2012. Illegal timber trafficking, which has also forced indigenous populations to migrate from their homelands, is one culprit, but slash-and-burn and other space-clearing activities, particularly for coca growing, have also driven Peru’s current deforestation. Forest concessions for Brazil nuts, which are inscribed in law, have also exacerbated the problem (Myers, N, 1994).
We believed that travel time estimations from city centers and settlements would be helpful in identifying which areas of forests are most likely to experience deforestation, given that cities serve both as sources for capital, including human capital, and as final markets. In particular, we surmised that areas temporally close and accessible to cities will experience significant attention, resulting in clustered deforestation. This is a problem because clustered deforestation, as opposed to well-distributed deforestation, presents increased risk of total loss for forests, which is particularly precarious in areas such as the Amazon, where biodiversity is invaluable and irreplaceable.
We first created a cost-distance grid based on roads, railways, rivers, land cover, and slopes. We then analyzed deforested areas in the year 2012, comparing these to the travel times that we calculated. From this study, we hoped to attain a better understanding of how policies need to be implemented spatially to encourage sustainable harvesting practices.
Map1: Research Area (Country boundary and amazon forest of Peru). Source: MODIS

Map2: Input for travel time to markets in Peru. Source: GEM, MODIS, VMAP0

Map3: Travel time in Peru’s amazon forest with all settlements as markets. Source: GEM, MODIS, VMAP0

Map4: Travel time in Peru’s amazon forest with over 30,000 population cities as markets. Source: GEM, MODIS, VMAP0

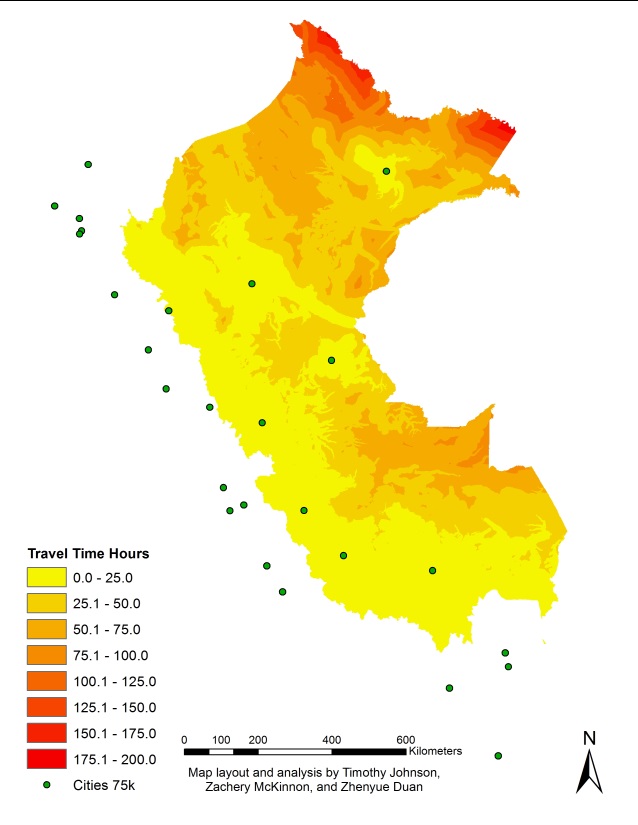
Map5: Travel time in Peru’s amazon forest with over 75,000 population cities as markets. Source: GEM, MODIS, VMAP0
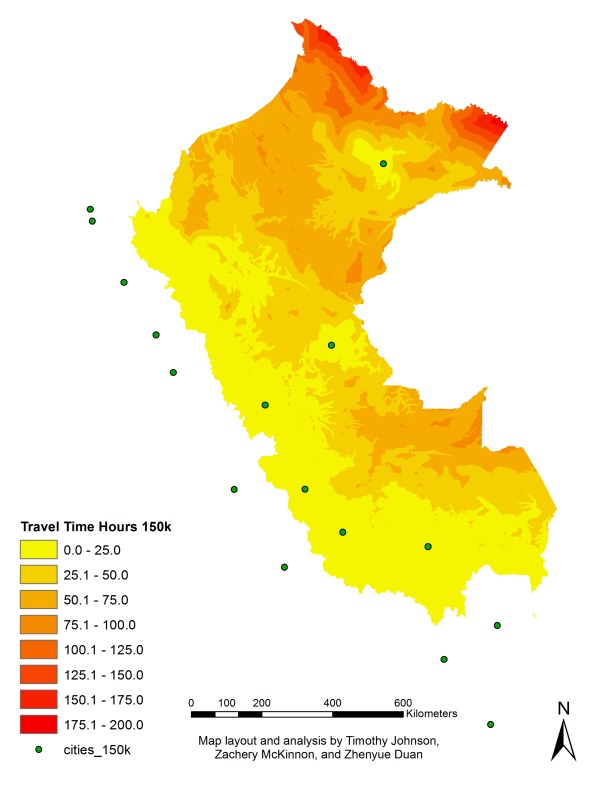
Map6: Travel time in Peru’s amazon forest with over 150,000 population cities as markets. Source: GEM, MODIS, VMAP0
Map7: Kernel density of deforestation areas in Peru Amazon Forest, 2012. Source: MODIS
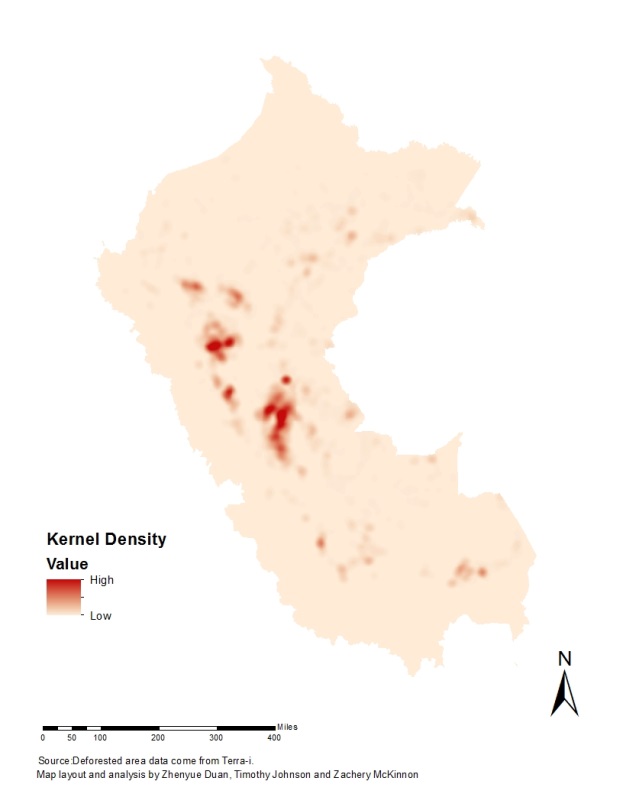
Table1: Time Equivalent for Land Cover Types
| Land Cover Type | Speed | Time per 1,000m Cell |
| Primary Roads | 60km/hr | 1 |
| Railroads | 30km/hr | 2 |
| Secondary Roads | 30km/hr | 2 |
| Urban | 30km/hr | 2 |
| Perennial/Permanent Rivers | 20km/hr | 3 |
| Water Bodies | 20km/hr | 3 |
| Grass/Shrubland | 2.5km/hr | 24 |
| Open Forest | 1.67km/hr | 36 |
| Permanent Snow/Ice | 1.25km/hr | 48 |
| Closed Forest | 1km/hr | 60 |
| Slope (factor applied to landcover) | (EXP (-3 * Tan(0.0174532925* “slope”)) | |
Table2: Relationship between deforested areas and travel time (all settlements)
| All Settlements |
Total Deforested Areas |
Number of Cells |
Deforested Areas per Square Km |
Percentage of All Deforested Areas |
| 0-25 Hours | 26848 | 598239 | 0.0449 | 82.0764 |
| 25-50 Hours | 5199 | 281308 | 0.0185 | 15.8937 |
| 50-75 Hours | 606 | 60506 | 0.0100 | 1.8526 |
| 75-100 Hours | 44 | 11582 | 0.0038 | 0.1345 |
| 100-125 Hours | 10 | 4589 | 0.0022 | 0.0306 |
| 125-150 Hours | 2 | 2287 | 0.0009 | 0.0061 |
| 150-177 Hours | 2 | 736 | 0.0027 | 0.0061 |
Table3: Relationship between deforested areas and travel time (75,000 population city)
| Cities Over 75,000 |
Total Deforested Areas |
Number of Cells |
Deforested Area per Square Km |
Percentage of All Deforested Areas |
| 0-25 Hours | 19065 | 397357 | 0.0480 | 58.2831 |
| 25-50 Hours | 10471 | 303471 | 0.0345 | 32.0106 |
| 50-75 Hours | 2822 | 177643 | 0.0159 | 8.6271 |
| 75-100 Hours | 212 | 40957 | 0.0052 | 0.6481 |
| 100-125 Hours | 82 | 19979 | 0.0041 | 0.2507 |
| 125-150 Hours | 42 | 12668 | 0.0033 | 0.1284 |
| 150-175 Hours | 16 | 6152 | 0.0026 | 0.0489 |
| 175-200 Hours | 1 | 1020 | 0.0010 | 0.0031 |
