
In this post, I won’t speculate on the phenomenon that is Donald Trump or which portion of the population shares his beliefs. That stuff has been and continues to be well covered. Instead, I’ll simply speculate on strategy: how to flip the median voter and in turn flip states.
The main indication that Democrats are taking strategizing seriously is with the unrolling of their new mission statement, A Better Deal. But while it’s most definitely an attempt at realignment, it’s frankly not enough. In it, the Democrats provide three objectives: raise wages, reduce costs, and build the economy. Although the new goals do represent some divorcing from identity politics and the environment, they are, for all intents and purposes, the objectives of every government in the history of mankind, and Democrats are going to have to do a lot more than state the obvious to win over hearts and minds not just in 2018 but also in every other even year to come.
So what does a substantive strategy look like? Well, answering this begins with understanding what the country looks like. To that end, I conducted a principal components analysis using the scaled variables Religion, an aggregate religiosity index measuring citizens’ faith; Pop_density, the population density; HDI, the state human development index; GDP_capita, the GDP per capita; and Bachelors, the percent of citizens holding a bachelor’s degree, for 50 data points, i.e., the 50 states.
For the purposes of visualization and simplification, I mainly investigated the first two components, which nicely represent two aspects of politics. The first component, which basically covers all indicators of ideology in a way consistent with the left-right divide, accounts for 68% percent of the variance in states. Meanwhile, the second component, though far from a perfect indicator, represents some nonpartisan notion of value basis, positively loading both religion, which is itself a value and also likely a proxy for conservative values, and population density, which is not a value in itself but is likely a proxy (though not a great one) of progressive values. It accounts for 16% of the variance. Together, the two components explain 84% of the variance. The following are the loadings of each variable into the 2 components.
| Comp. 1 | Comp. 2 | |
| Religion | -0.41 | 0.58 |
| Pop_density | 0.35 | 0.81 |
| HDI | 0.52 | -0.02 |
| GDP_capita | 0.44 | -0.04 |
| Bachelors | 0.5 | -0.03 |
| ideology | value level |
Next, I plotted the states and their electoral results in the last presidential election with component 1 as the x-axis and component 2 as the y-axis. The blue circles are Democratic states, and the red crosses are Republican states. The exact values for each state are reported in the Appendix.
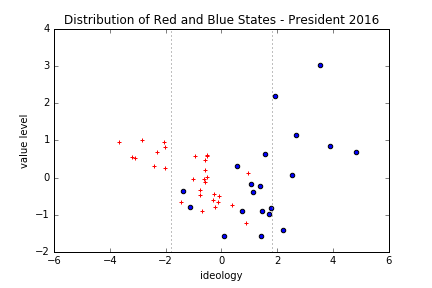
In terms of what separates conservatives from progressives, we can look mostly at the left-right variance, which has been separated by gray lines in the above graph. In particular, the area between the gray dotted lines is within one standard deviation (+/-1.8) of the mean (0) of component 1.
Look at the nation in terms of four parties, not two.
Highlighting the standard deviations in the graphs roughly demonstrates a fact about partisan politics: Although we vote for one of two parties, there are probably at least three (conservatives, the middle, and progressives). To explore this observation in greater detail, we can conduct k-means, a clustering algorithm that splits data into neighborhoods of points based on within-group similarity and between-group differences. We first use the elbow method to determine the optimal number of clusters. This method basically looks for the last point at which there is a discernable bend in ‘fit’. In this case, we define ‘fit’ as maximizing the percentage of explained variance and minimizing the average within-cluster sum of squares.

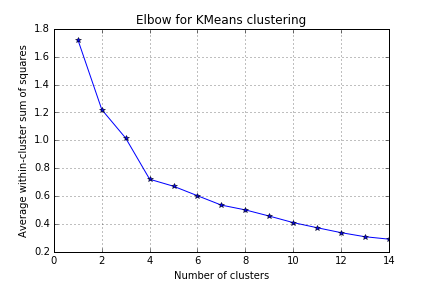
Both measures of fit indicate that the best and final elbow is at 4 clusters. That means that splitting the states into 4 groups is a more logical choice than 2 (Democrats and Republicans). We are left with the following situation.
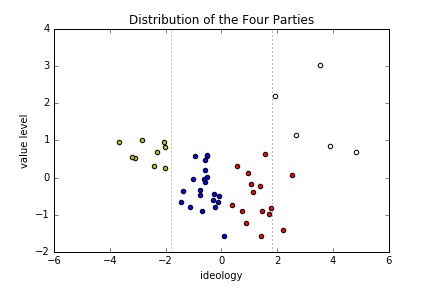
| Yellow States | Blue States | Red States | White States | |
| AL, AR, KY, LA, MS, OK, SC, TN, WV | AZ, FL, GA, ID, IN, IA, KS, ME, MI, MO, MT, NE, NV, NM, NC, OH, SD, TX, UT, WI, WY | AK, CA, CO, DE, HI, IL, MN, NH, NY, ND, OR, PA, VT, VA, WA | CT, MD, MA, NJ, RI | |
| No. of States | 9 | 21 | 15 | 5 |
| Dem States | 0% | 14% | 80% | 100% |
The yellow states are basically those that are unwinnable for Democrats, and the white states are basically those that are unloseable for Democrats. In addition, component 2 suggests that the blue and red states are more than just a blending of progressives and conservatives. They represent a departure from and possible rejection of value politics that could[1] be just as notable as the left-right divide, approximating to the following situation.
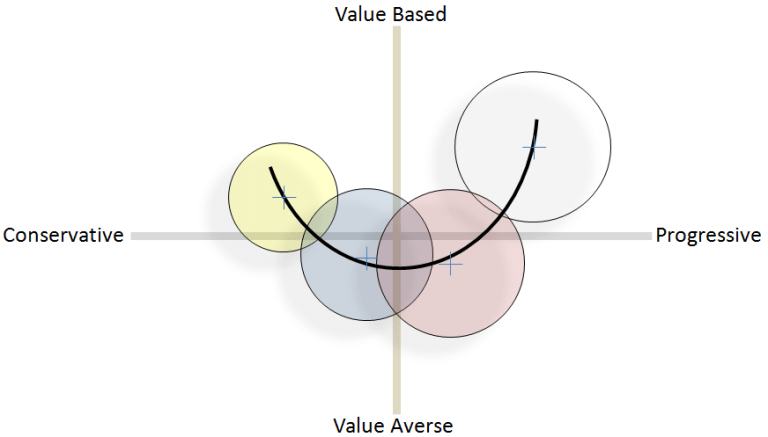
In this sense, the political middle is a misnomer as it represents the center in only one dimension, and instead of thinking only about the two poles of partisanship, Democrats should be thinking about strategizing in much the same way as parties in a many-party system, with the major caveat being that only the two middle parties ever truly hold power.
Stop trying to mix oil and water.
Democrats are going to have to strike a compromise between the red, blue, and white states (RBW), which I’ll concede is something the party has already taken to heart. Furthermore, given that centrists hold the cards, that compromise will necessarily have to be weighted in their favor. However, what the party hasn’t considered, and perhaps it’s because they haven’t yet thought of themselves as part of a true four-party system, is the point at which coalition building occurs.
A Better Deal seems to suggest that Democrats will try to make it happen before the election. That is, as a national party, they intend to come up with some formula that will appeal to all of RBW. This task is virtually impossible given that a large part of the middle stands in opposition or in disinterest to values themselves. That is, they are likely pragmatists, concerned not so much with the means as the ends: a healthy economy. The idea that one party can stably unite both input-oriented ideologues and the output-oriented middle under a single banner is ridiculous; just ask Republicans.
Promulgate state agendas, not national ones.
In contrast to pre-election top-down consensus building, in a many-party system, coalition building happens after an election. That means party platforms are formulated not at the national level but at the coalition level. The easiest way to turn coalition-level consensus building into something actionable in the US is to think about it on the state level, with Democrats treating each state as its own coalition. Democrats should not only be labeling themselves as individual state parties (in the vein of Minnesota’s Democratic-Farmer-Labor Party), united only under some abstract notion of the left, but also be unraveling policy positions accordingly, i.e., in ways that suit the needs of their home state first and the party second.
This strategy may seem to be an abandonment of principled progressivism, and, in some ways, it is. Indeed, many people who oppose important progressive issues could and likely would be brought into the Democrats’ tent. However, in other ways, this strategy is progressivism’s last defense. Now, the national platform doesn’t have to be watered down to bare-bone economic politics amenable to the center, because a national agenda wouldn’t even exist. The Californias of the world could continue to lead the way on a progressive agenda, while the Nevadas adopt more pragmatic approaches.
Furthermore, portraying this strategy as self-defeating of progressive values assumes (1) that Democrats could win without such a compromise, despite overwhelming evidence to the contrary, and (2) that these new Democratic centrists would be unmovable. The fact that Republicans Susan Collins and Lisa Murkowski opposed Trumpcare largely on the grounds of protecting Planned Parenthood shows that those representing the messy middle can in fact be very reasonable (Susan Collins also happens to be quite good on the environment). Furthermore, much of the written law on the culture wars leans to the side of progressivism (although some is being unwritten as we speak), so opposition to progressivism would mean undoing the legal status quo, an inherently difficult task.
Altogether, this strategy avoids the false dilemma of Democrats having to choose between appeasing the Obama-Trump white voter and staying true to minority rights and the environment, at least on a national level, while providing the added benefit of undoing some of the gridlock plaguing legislative chambers across this country.
[1] Better indicators of value politics are needed in order to assess the true size of the up-down variance.
Appendix
| state | ideology | value_level | pres_margin |
| Massachusetts | 4.83 | 0.70 | −27.20% |
| Connecticut | 3.91 | 0.86 | −13.64% |
| New Jersey | 3.55 | 3.03 | −13.99% |
| Maryland | 2.67 | 1.13 | −26.42% |
| New York | 2.54 | 0.07 | −22.49% |
| New Hampshire | 2.20 | -1.42 | −0.37% |
| Rhode Island | 1.92 | 2.20 | −15.51% |
| Minnesota | 1.78 | -0.81 | −1.52% |
| Colorado | 1.72 | -0.97 | −4.91% |
| Delaware | 1.57 | 0.64 | −11.39% |
| Washington | 1.45 | -0.89 | −15.71% |
| Vermont | 1.40 | -1.57 | −26.41% |
| California | 1.37 | -0.23 | −30.11% |
| Hawaii | 1.15 | -0.40 | −32.19% |
| Illinois | 1.07 | -0.16 | −17.07% |
| Pennsylvania | 0.94 | 0.13 | 0.72% |
| Alaska | 0.88 | -1.22 | 14.73% |
| Oregon | 0.74 | -0.89 | −10.98% |
| Virginia | 0.57 | 0.31 | −5.32% |
| North Dakota | 0.39 | -0.74 | 35.73% |
| Maine | 0.09 | -1.56 | −2.96% |
| Kansas | -0.10 | -0.49 | 20.60% |
| Wyoming | -0.12 | -0.67 | 45.77% |
| Wisconsin | -0.22 | -0.79 | 0.77% |
| Iowa | -0.26 | -0.43 | 9.41% |
| Nebraska | -0.29 | -0.59 | 25.05% |
| Utah | -0.51 | 0.00 | 18.08% |
| Florida | -0.51 | 0.57 | 1.20% |
| North Carolina | -0.52 | 0.62 | 3.66% |
| Texas | -0.58 | 0.20 | 8.99% |
| Ohio | -0.58 | 0.47 | 8.13% |
| Michigan | -0.60 | -0.13 | 0.23% |
| Missouri | -0.63 | -0.03 | 18.63% |
| Montana | -0.71 | -0.91 | 20.42% |
| Arizona | -0.78 | -0.47 | 3.54% |
| South Dakota | -0.78 | -0.33 | 29.79% |
| Georgia | -0.94 | 0.57 | 5.13% |
| Indiana | -1.00 | -0.03 | 18.91% |
| Nevada | -1.13 | -0.78 | −2.42% |
| New Mexico | -1.37 | -0.37 | −8.22% |
| Idaho | -1.44 | -0.66 | 31.77% |
| Oklahoma | -2.02 | 0.25 | 36.39% |
| South Carolina | -2.04 | 0.81 | 14.27% |
| Tennessee | -2.05 | 0.95 | 26.00% |
| Louisiana | -2.30 | 0.69 | 19.64% |
| Kentucky | -2.42 | 0.30 | 29.84% |
| Alabama | -2.85 | 1.00 | 27.72% |
| Arkansas | -3.09 | 0.53 | 26.92% |
| West Virginia | -3.20 | 0.55 | 42.07% |
| Mississippi | -3.66 | 0.96 | 17.83% |
